

“Massive” Arctic Heat Dome Sets Up to Bake Sea Ice
7
July , 2015
There’s
a massive heat dome building over an Arctic sea ice pack that is
looking increasingly fragile in both model forecasts and
observations. In short, very bad weather for sea ice is rapidly
settling in even as the ice pack, despite recent place gains in some
measures, is looking increasingly weak.
*
* * * * *
First
the somewhat good news… Arctic sea ice extent has backed off to
about 8th lowest on record. Arctic
sea ice area is at about 4th lowest on record.
And Arctic sea ice volume, according to DMI, is
in the range of 3rd lowest on record (PIOMAS
looks even better). This report may sound rather bad, but when
compared with late
May and early June when sea ice extent measures were at or near new
record lows the
data could arguably be characterized as an improvement. Yeah, there’s
been some big area drops recently,
but all in all, not too terrible, right?
Probably
wrong… Because the Arctic is gearing up for a very powerful heat
wave over the coming week. One that is likely to spike maximum summer
temperatures in the High Arctic, a region that seldom shows much
variance on the side of hot or cold at this time of year, by 0.5 to
1.5 C above average. A heatwave my somewhat more reserved fellow ice
observer, Neven, has called ‘HUGE’ (note that Neven seldom uses
caps lock) and is characterizing as something he’s not seen in all
of his five years of sea ice observation. From
The Arctic Sea Ice Blog Today:
…However, there is one big difference compared to last year and that’s heat. Despite a very cold start, there have been several outbreaks of warm air over the ice, slowly but radically shifting the balance between extent and area data. The impact is felt on the surface of the ice pack, but doesn’t translate directly into a decrease. Not yet. In theory, it should percolate through after a while, especially if the heat persists. And right now the Arctic sea ice pack is undergoing a massive heat wave which shows no signs of letting up.
I
find myself in agreement with Neven. The massive heat build in the
Arctic predicted for this week is likely to be a significant event
with potentially wide-ranging impact. But to understand why, it helps
to get an overall picture of the broader context in which this
particular heatwave is occurring. And that context includes two other
stories as well — the story of human-forced climate change and the
story of a still developing and potentially monstrous El Nino.
Ocean
Warming Injects Heat into the Arctic
To
get an idea how warming in the Equatorial Pacific and over-all
greenhouse gas based warming can have such a far-flung impact,
particularly on the currently building Arctic heatwave, it always
helps to take a look at the behavior of the circumpolar Jet Stream.
Large areas of persistently warmed water, like the one we have seen
now for two years over the Eastern Pacific, have a tendency to
generate high amplitude ridges in the Jet. Ridges that serve as open
avenues for heat transport into the Arctic. Specifically yesterday a
huge pulse of heat was traveling north along just such a high
amplitude and ocean-warmed ridge:

(Amazing
high amplitude Jet Stream wave punching all the way through to the
High Arctic on the back of the Eastern Pacific’s Ridiculously
Resilient Ridge. Image source: Climate
Reanalyzer.)
Our
particular heat transporter should by now be very familiar — a
ridiculously resilient ridge (RRR) — extending northward and
buttressed by multiple high pressure cells stubbornly entrenched over
abnormally hot water in the Eastern Pacific. Yesterday (Monday, July
6) the ridge elongated. South to north winds over-riding northward
flowing warm, salty ocean water. Running up through Alaska, the
heat pulse set off all-time daily highs in places like Anchorage (81
degrees and breaking the record set in 1972). The heat then spilled
into the Bering, Chukchi and Beaufort Seas where it met with
adjoining, though lesser heat pulses over-riding Greenland and the
Laptev. A gathering pocket of hot, thick air that is now pooling in
the so-called sea ice ‘safe zone’ just north of Greenland.’
A
precursor to the very intense high pressure cell we see developing
now.
But
before we go on to tell the tale of our gathering Arctic heatwave we
should first take a closer look at ocean surface temperatures. As
these give us a rather clear picture of the Arctic’s current
vulnerability — providing for us a hint as to why heat will
intensify most strongly to the north of the Canadian Archipelago and
Greenland. For it is ocean surface heat that built the road that warm
air followed:

(Heat
plume running all the way from Equator to Pole clearly reflected in
this July 6NOAA/ESRL SSTA
anomaly map.)
Taking
a look at NOAA’s July 6 Sea Surface Temperature Anomaly (SSTA) map,
we find a massive plume of much warmer than normal (1971-2000) waters
extending up from a plainly visible El Nino pattern, all throughout a
large sweep of the Eastern Tropical Pacific. Moving northward, these
steamy waters spill into two hot blobs off the Mexican, US, and
Canadian coasts — a heat pool that again punches up through the
Chukchi and Beaufort Seas. An Equator to Pole expanse of ominously
hot water that is enabling both sea ice melt in the regions directly
impacted as well as a broader invasion of warmth into even the sea
ice’s most secure haunts.
Heat
Directly North of Greenland, Canadian Archipelago
Warmth
that today aided in the formation of an Arctic high pressure ridge
hitting significant heights of 1030 to 1035 mb directly between the
Pole and Greenland. At 1245 Eastern Standard Time, the ridge had
already intensified to 1032 mb. And for at least the next seven days
both the GFS and the Euro model shows a 1025 to 1035 mb high pressure
cell dominating the same region.


(Left
frame shows strong, 1032 mb high pressure system settling in to the
region just north of Greenland on July 7. By July 10 [right frame],
this ridge is predicted to have greatly warmed the Central Arctic
zone between Greenland and the Pole. Image source: Earth
Nullschool.)
This
persistent ridge will remove cloud cover in a large area between
North America and the Pole. Sunlight, at its seasonally most intense,
will multiply already widespread melt ponds on the sea ice surface.
The combined solar forcing and loss of albedo will push surface
temperatures higher as the ridge remains in place. And by Friday a
broad band of 2-4 C temperatures is predicted to form in a bulge over
the Arctic Ocean north of Greenland and the Pole. Abnormally warm
temperatures and direct sunlight that will, over the next week,
increase melt pressure over the last remnant of thick sea ice left to
the Arctic.
In
addition to reducing cloud formation and enhancing the melt-forcing
impact of sunlight on the sea ice, high pressure cells in this region
will have a couple of further influences. First, they will tend to
compact the sea ice overall — drawing in the fringe ice while
generating warm water upwelling at the ice edge. And second, the
clockwise motion of air circulating around a strong high pressure
cell will nudge sea ice out of the Central Arctic toward the gateway
of the Fram Strait. Add in the significant impact due to reduced
cloud formation allowing sunlight to contact sea ice during a period
of peak solar radiative forcing and we end up with a substantial
overall blow to the sea ice.

(Extraordinary
high temperature anomalies are predicted for the Arctic from July
7-17. A departure more typical for winter when human greenhouse
gasses have the greatest heat-amplifying impact. Image
Source: meteomodel.)
Taking
a look at the meteomodel anomaly map above, we find a very extreme
warming of the Central Arctic predicted over the next ten days. A
heat pulse to rival 2012 for this period. A melt multiplying heatwave
that is predicted to push anomalies for the entire Arctic above +1.5
C beyond the early July average. A polar amplification similar to
what is typically a winter manifestation of human emissions-driven
anomalous warmth — this time anomalously occurring during a period
when heat for the region is approaching peak intensity.
Impacts
to Sea Ice Could Be Substantial
In
the face of this oncoming weather, ice pack strength would be a
deciding factor lending resiliency during melt-promoting conditions
or a shift to a much more rapid rate of decline. Though some
indicators, including a seemingly slower rate of decline during late
June, may point toward more ice resiliency, a growing number of
satellite reports and model analysis hint at a general and overall
weakness throughout the ice pack.
This
weakness can best be described as model indication of thin or low
concentration ice, already widespread melt ponding, and visual
indication of ice weakness in the satellite shot.

(The
US Navy’s GLBb model has always been unfriendly to sea ice. But
other models are now starting to agree. Image source: US
Navy.)
For
low concentration ice, no model is more stark than the US Navy’s
experimental GLBb sea ice thickness ensemble. I colloquially think of
this as the ‘holy crap’ sea ice model. This label due to the fact
that if sea ice state is really as bad as the model indicates, then
the ice is basically toast. Starting in June, this model displayed a
great overall weakness in the sea ice and, according to its analysis,
the situation has progressed from bad to worse with most of the
remaining Arctic Ice possessing a thickness of 1.2 meters or less.
Easily thin enough for any nudge by weather to really start rapidly
bringing the ice down and opening up very large expanses of open
ocean.
If
the GLBb ‘holy crap’ model were the only sea ice model making us
want to say ‘holy crap!’ then we could probably breathe a bit
easier. Unfortunately, another US Navy model is now also tending to
elicit this response in reaction to its predictions for the next 7
days and more specifically for the next 3 days:

(The
US Navy’s ARCc sea ice concentration model predicts a very rapid
rate of sea ice decline over the next few days. Image source US
Navy.)
The
top image in this up and down comparison shows the US Navy’s ARCc
model’s interpretation of sea ice concentration for July 6 of 2015.
Note the extensive green regions showing a 40-50 percent sea ice
concentration. It’s a huge swath of ice including large sections of
the Chukchi, the Beaufort the ESS, the Laptev, as well as remaining
ice in the Kara Sea, and Baffin and Hudson Bay. Now watch what
happens to those large sections of lower concentration ice from July
7 to July 10 in the ARCc model 30 day history and forecast summary.
Almost all that green is wiped off the map. It’s like losing about
1 million square kilometers of extent and 600,000 kilometers of area
in just 72 hours. Or about 10,000 square kilometers of ice per hour.
A precipitous fall that would mark an extraordinary and likely
unprecedented rate of loss should it emerge as the Navy model
predicts.
But
you know what they say about models — no model is perfect and every
model ends up wrong in some manner or another. So the question here
is — how likely is it that the Navy models could be correct or
incorrect this time?
To
try and tease this answer out we could also look at other sea ice
concentration maps. Notably all the major ones including Cryosphere
Today, Uni
Bremen,
and NSIDC currently
show sea ice looking either thin or very thin. Specifically, Uni
Bremen has shown some amazing contrast over the past 48 hours:
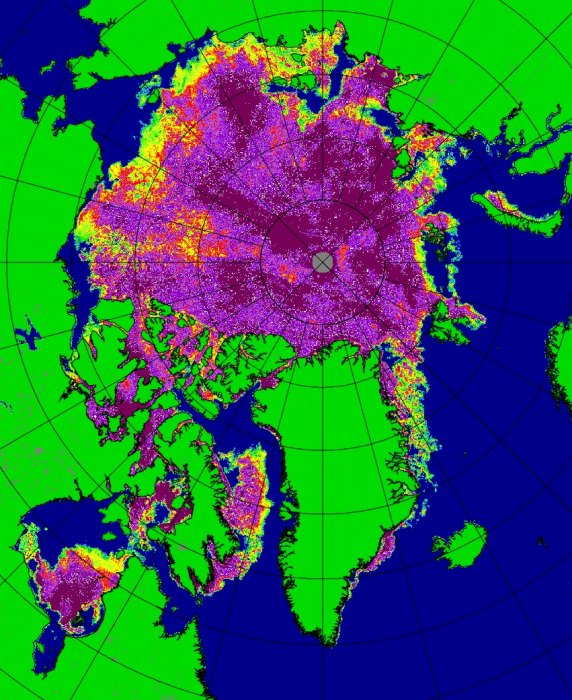
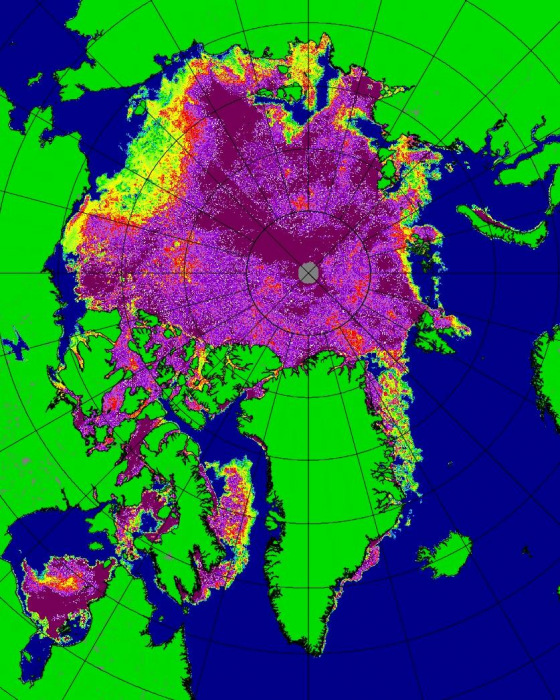
(AMSR2
model analysis of sea ice surface state shows very rapid thinning in
the Beaufort and Chukchi Seas during the past 24 hours. Image
source: Uni
Bremen)
The
left image in the above comparison is from the AMSR2 model analysis
for Arctic sea ice concentration on July 5. The right image is the
same analysis but for July 6. Note the substantial change in the sea
ice concentration for the Beaufort and Chukchi seas over just one
day. A change that is consistent with the pulse of warm air and water
riding up through the Eastern Pacific and through Alaska, the Bering
and the Chukchi. Another holy crap moment, and not at all of the good
variety. To say the least, a similar response north of Greenland and
the CAA would be devastating.
Moving
away from models and back to observations we find that from the
satellite vantage the entire Arctic Ocean displays an ice pack in
various shades of azure. By color analysis alone we can readily see
that the 2015 ice (July 6 MODIS image) is far more melt pond embedded
than 2014 or 2013. 2012 is a tough comparison due to NASA-MODIS’s
format change from that year. But the widespread melt ponding alone
hints at a reduced resiliency for the ice when compared with recent
years.

(Arctic
sea ice turns blue color characteristic of widespread proliferation
of melt ponds on July 6. Also note very thin and diffuse sea ice in
the Beaufort and Chukchi. Image source:LANCE-MODIS.)
Turning
to the Chukchi and Beaufort, we see a visible confirmation of the
weakness indicated in the US Navy and Uni Bremen models. Beneath the
smoldering outflow of the Alaskan fires we can plainly see the
decayed state of ice. The floes greatly disassociated with widening
gaps appearing between diminishing ice clusters.
As
satellite gives us an overall view of the Arctic from above, local
observations can help provide a sense of the sea ice state at the
surface. During recent years, cameras mounted on buoys throughout the
Arctic have provided us with a first-hand account of the story of
Northern Hemisphere sea ice decline. And during recent days almost
every camera-based buoy has shown an extensive expansion of melt
ponds and open water. (Extensive melt ponding extends as far north
as the
Pole).
In
the swiftly thinning ice pack of the Beaufort even the contrast of a
single day can be quite stark.


(Warm
storm kicks up under the gradient imposed by a building heat dome of
the Arctic. Top and bottom frame provides a stark tale of impacts in
just one 24-hour period. Image source: USIABP.)
In
the above top-bottom comparison of RACS#2 ice buoy photos we find
that wide but placid areas of sunlit open water in the Beaufort Sea
on July 6th (top frame) have rapidly transformed to wind-driven 1-2
foot waves whipped up by 15-25 mile per hour winds on July 7th
(bottom frame) in association with a tightening gradient around the
strengthening high pressure in the Central Arctic. Waves of this kind
can deliver a significant amount of melt forcing to the ice —
mixing cooler surface waters with warmer waters below as well as
rocking through the ice floes with a rain of incessant, ice-breaking
blows.
Conditions
in Context: Rapid Melt Likely On the Way
Increasing
model agreement indicating rapid sea ice melt, observations of sea
ice weakness via satellite and buoy based systems throughout the
Arctic, and predictions of a substantial Arctic heatwave all point
toward a high and rising risk of rapid sea ice melt. Larger global
trends, particularly heat transport from the Equatorial Pacific all
the way to the northern Polar zone through the mechanisms of El Nino,
human based greenhouse gas heat forcing, and the associated
Ridiculously Resilient Ridge, heighten this risk even further.
Finally, a wide array of observations indicate that such rapid melt
is already starting to set in. Given this increasing agreement and
confluence, it appears that the late June ice dispersal is likely
over and that serious trouble for Arctic sea ice has now set in and
will remain in play for at least the next seven days.
Links:
Hat
Tip to Neven
Hat
Tip to Frivolous
Hat
Tip to Jim
Hunt
Hat
Tip to Climate Hawk
No comments:
Post a Comment
Note: only a member of this blog may post a comment.