

At Start of 2015 Melt Season, Arctic Sea Ice is in a Terrible State
10
April, 2015
Strong
Polar Amplification. With human-forced climate change, it’s
normally something you’d tend to see during winter time. By spring,
the increase in solar radiation in the Mid-Latitudes would tend to
force a more rapid pace of warming there. The snow and ice cover,
recently refreshed by winter, would be at highest annual albedo at
winter’s end. That high albedo would create a warming lag from the
upper Latitudes. The resulting increase in temperature differential
would then tend to reinforce the Jet Stream — giving it a
strengthening kick and providing the polar north with a kind of
ephemeral haven. At least for a brief window during early spring
time.
Not
so with 2015. This Spring, the Jet has been a basketcase. A mess of
meanders like a river finding its way through a wetland prior to
joining the sea. Strong south to north flows have persisted over the
North Atlantic and well into Western Siberia. These meridional
patterns have repeatedly delivered heat into the Arctic —
particularly through the oceanic gateway between Greenland and the
Yamal region of Russia.
Unusually
Warm Spring for The Arctic
For
the past week, this pattern intensified and the result is a bulge of
extreme heat extending on toward the North Pole in the broad zone
between Greenland and Northwest Siberia:
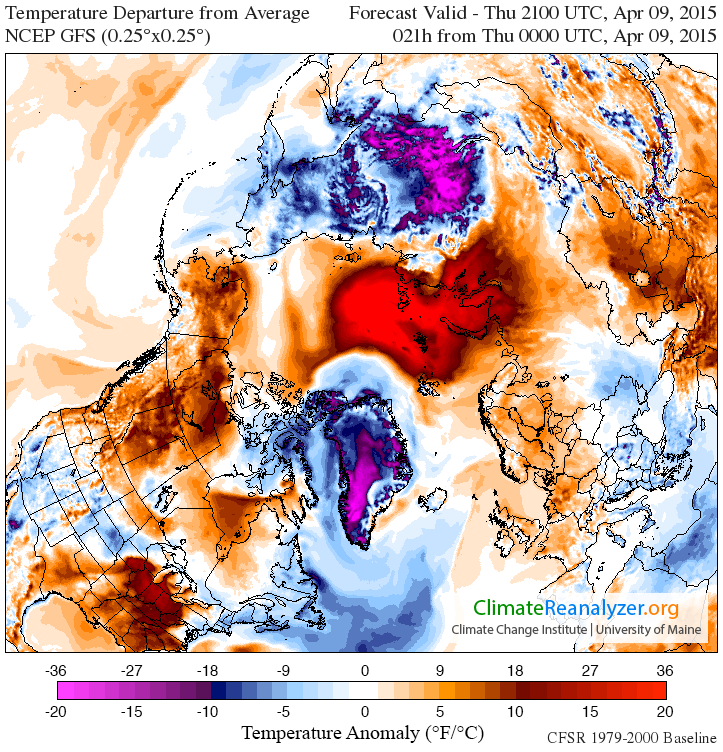
In
the above image, provided by Climate
Reanalyzer,
we find a classic polar vortex disruption type pattern (a rather odd
event for April, as both polar amplification and vortex formation
have both tended to fade by this seasonal period) in which the cold
core is essentially ripped in half by warm air invading from the
south. In this case, we see a massive warm air flood emerging from
Eastern Europe, Western Russia and the North Atlantic riding up and
over the polar zone across a warm frontal boundary. This greater warm
air influx is joined with a lesser one emerging off the Ridiculously
Resilient Ridge pattern off the US and Canadian West Coasts and
flooding up over Alaska and the Mackenzie Delta region of Canada.
The
cold cores are thus shoved aside. One has fled to a dubious haven
over Eastern Siberia. The second has taken a stronger hold over
Greenland. For the Greenland region, surface winds have encircled the
new, displaced, cold pool, generating a temperature boundary that is
sharply visible in the anomaly map. The dangerous weather-wrecking
“Storms
of My Grandchildren”
Greenland melt and polar amplification pattern — featuring a
Greenland cold pocket beside a meltwater-cooled North Atlantic zone
surrounded by angrily warming regions.
High
anomaly departures in the range of 15-20+ degrees C above average
cover about 1/3 of the high Arctic region above 80 degrees North
Latitude. Laptev, Kara, Barents and the Arctic Ocean proper are all
included in the heat bulge. Temperatures in this zone today spiked to
near or above the point at which sea ice melts at the surface (-2.5
C) with temperatures in the Kara in the 0 to -2 C range, temperatures
in the Laptev in the -2 to -4 C range and temperatures within 100
miles of the pole hitting around -3.8 C. For this region, these are
readings more typical to June or even July.
Record
Low Start to Melt Season
The
impacts to sea ice have been nothing short of unprecedented for early
season melt.
In
the extent measure we find that for the past month running we have
been at or near new record lows. Over recent days, consistent with
the strong surge of polar heat amplification, extent values have
again plummeted past previous record low values. Dropping by more
than 50,000 square kilometers for each day in the April 6-8
timeframe, the melt rate is exceedingly steep for this time of year.
With April 8 achieving a new record low extent of 14,073,000 square
kilometers — 95,000 square kilometers below the previous record low
of 14,168,000 set in 2006.
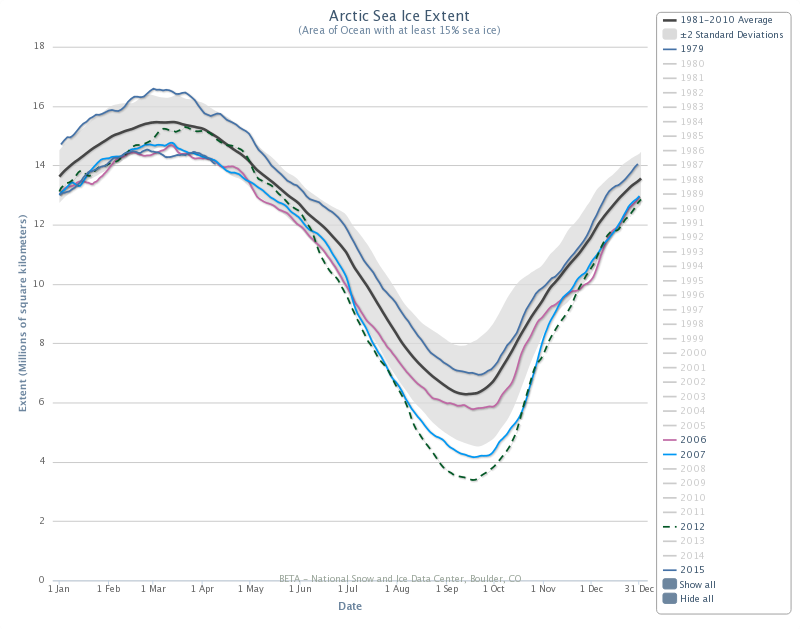
(Arctic
Sea Ice Extent as recorded by NSIDC through April 9 of 2015. We are
at the descending curve of the upper arc on the left in the image.
The bottom dark blue line represents 2015 sea ice extent. The light
blue and pink lines are 2007 and 2006 [previous record low years for
springtime]. The upper dark blue line represents 1979 sea ice extent.
The dotted green line represents 2012. Note how the 2015 line has
consistently trended in record low range during the past month. Image
source: NSIDC.)
As
heat and sunlight build in this record low ice extent environment,
greater stretches of dark, open water will trap more sunlight. This
will tend to have a heat amplifying effect — pushing for greater
ice losses as melt season gains traction. Weather trends will tend to
have an impact as well. And Arctic Oscillation (AO) is expected to
again hit a strongly positive level over the next couple of days —
providing further melt pressure to sea ice already at record lows.
Wind patterns have also tended to facilitate ice export through the
Fram, Nares and Bering Straits this year. Given a predicted
continuation of these conditions, the long term-trend seems to be
melt-favorable through end of April.
Kara
Melting Early, Beaufort Cracking Up
In
the satellite shot the impacts of these much warmer than normal
Arctic conditions are clearly visible. Particularly, the Kara Sea
near Northwestern Siberia and the Beaufort are showing signs of melt
stress and ice fragility.
For
the Kara, melt is proceeding well in advance of typical seasonal
thaw. Large polynyas have opened up even as the ice edge has
retreated. Much of the ice in this zone appears broken, thin, and
disassociated — making it vulnerable to both increasing solar
radiation and to the periods of more intense warmth to come.
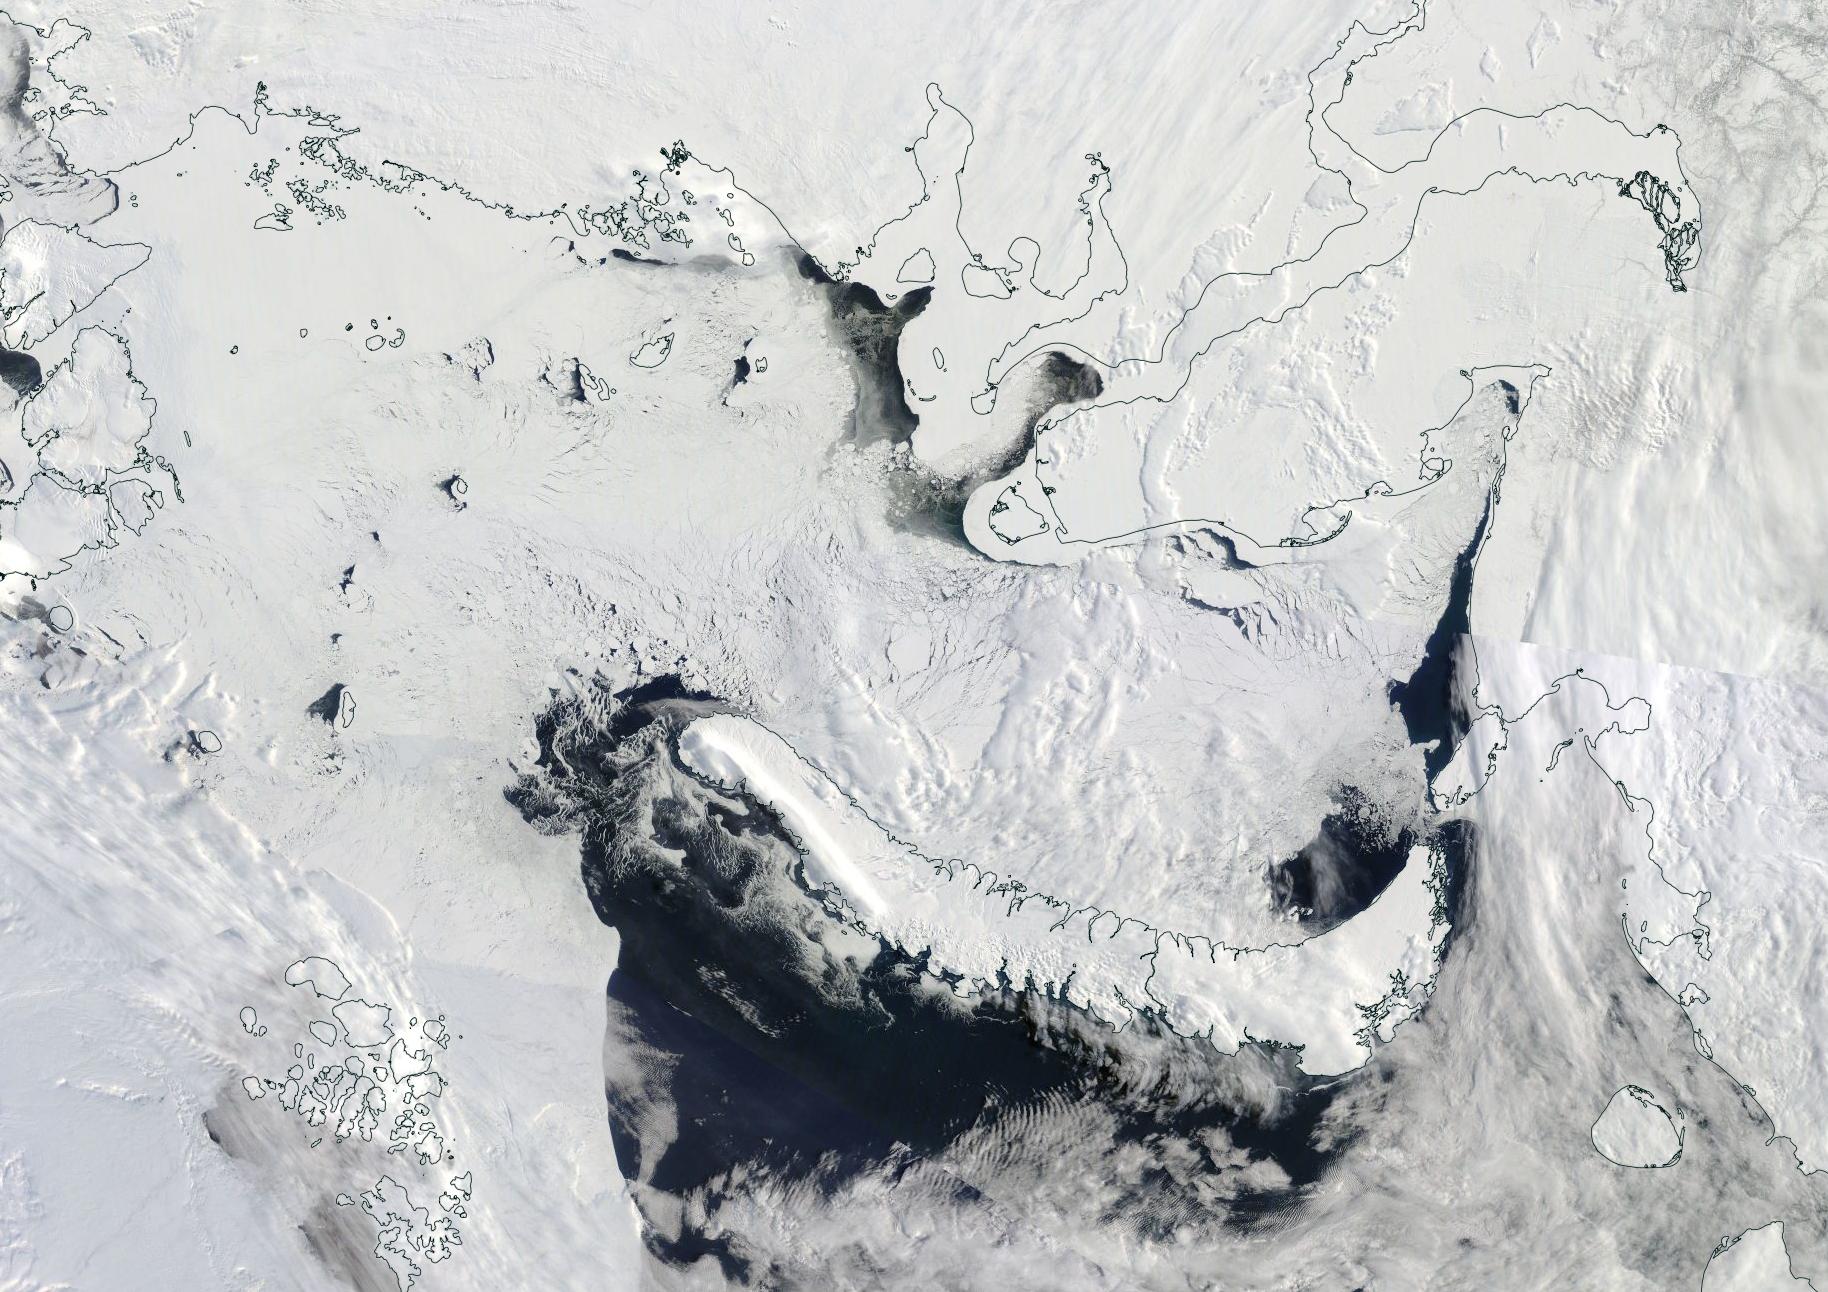
With
2015 showing a tendency for strong south to north air flows in this
region, the Kara continues to be at risk of early melt through spring
and into start of summer.
But
perhaps more disturbing is an ongoing and widespread break-up of sea
ice in the Beaufort. Starting in late March and continuing on through
April, very large cracks have opened up throughout the Beaufort Sea.
Given that air temperatures remain in a range cold enough to freeze
surface water (-12 to -25 C), the resulting gaps have quickly frozen.
However, this crack-up is occurring directly at melt season start.
Warmth is building, the sun is at an ever higher angle, and the lower
albedo cracks may well serve to capture more heat in an already
vulnerable region. In addition, temperatures in the Mackenzie River
Delta — a region that, when thawed, will dump above freezing water
into the already broken Beaufort — are approaching the melt point
(-4 C readings today and 0 C for widespread thaw).
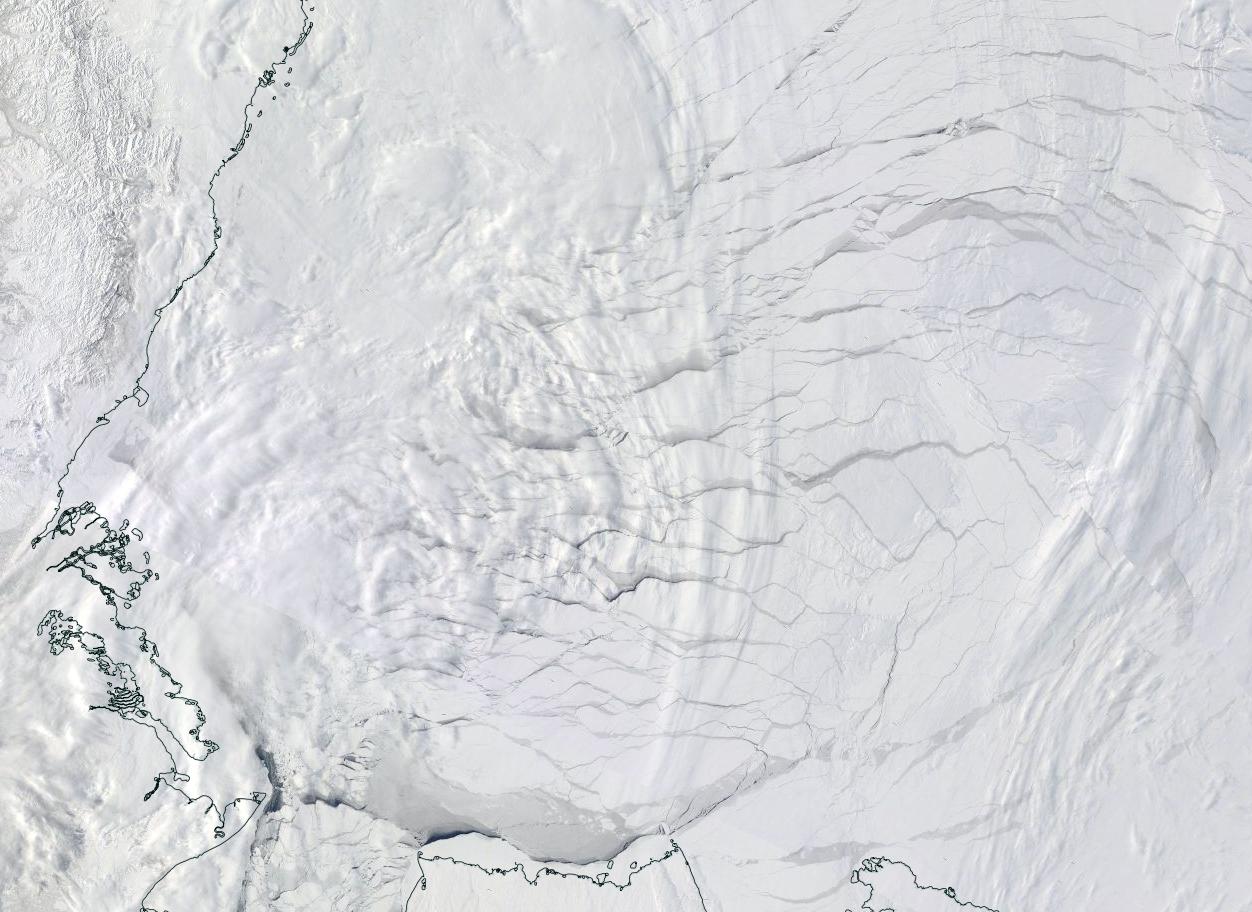
(Large
cracks and polynyas throughout the Beaufort Sea on April 10 of 2015.
Left side of frame is somewhat covered by cloud, but a large polynya
[partially frozen] is visible through the coverage. Image
Source: LANCE
MODIS.)
These
cracks are very extensive and include multiple large breaks. A scene
reminiscent of the winter 2013 break-up. But the current timing at
melt season start is far more likely to enhance ice vulnerability as
spring progresses toward summer. Also, the fragile behavior of this
broad section of Beaufort ice illustrates how thin sea ice in this
region has become even as it hints at the potential that warm water
(which is increasingly prevalent at depth throughout the Arctic
Ocean) may be upwelling to melt some of this sea ice from below.
Together,
the warm air influx and very high temperature anomalies, the rapid
melt at the edge zones, the record low extent levels, and the massive
crack-up ongoing in the Beaufort all point to extreme sea ice
weakness at the start of melt season. With weather patterns remaining
neutral to melt-favorable over the next few weeks and with winds
favoring export through the Fram, Bering and Nares, risks remain high
that Arctic sea ice will remain in record low territory over the
coming weeks. Sea ice fragility in certain regions, especially the
Beaufort, also bear watching for possible unpleasant surprises.
Links:
No comments:
Post a Comment
Note: only a member of this blog may post a comment.