

Greenland Ice Loss Increases Fivefold From Late 1990s, West Antarctica Not Far Behind
21
August, 2014
In
the early 1990s, it would have been hard to imagine the rates of
glacial ice loss we are seeing now.
There
were few ways to accurately measure the Greenland Ice Sheet’s mass.
Snow fell, glaciers calved. But observations seemed to show that the
great, cold ice pile over Greenland was in balance. Snow gathered at
the top, glaciers calved at the edges, but human heating of the
atmosphere had yet to show plainly visible effects.
At
that time, climate scientists believed that changes to the ice, as a
result of human caused heating, would be slow and gradual, and would
probably not begin to appear in force until later in the 21st
Century.
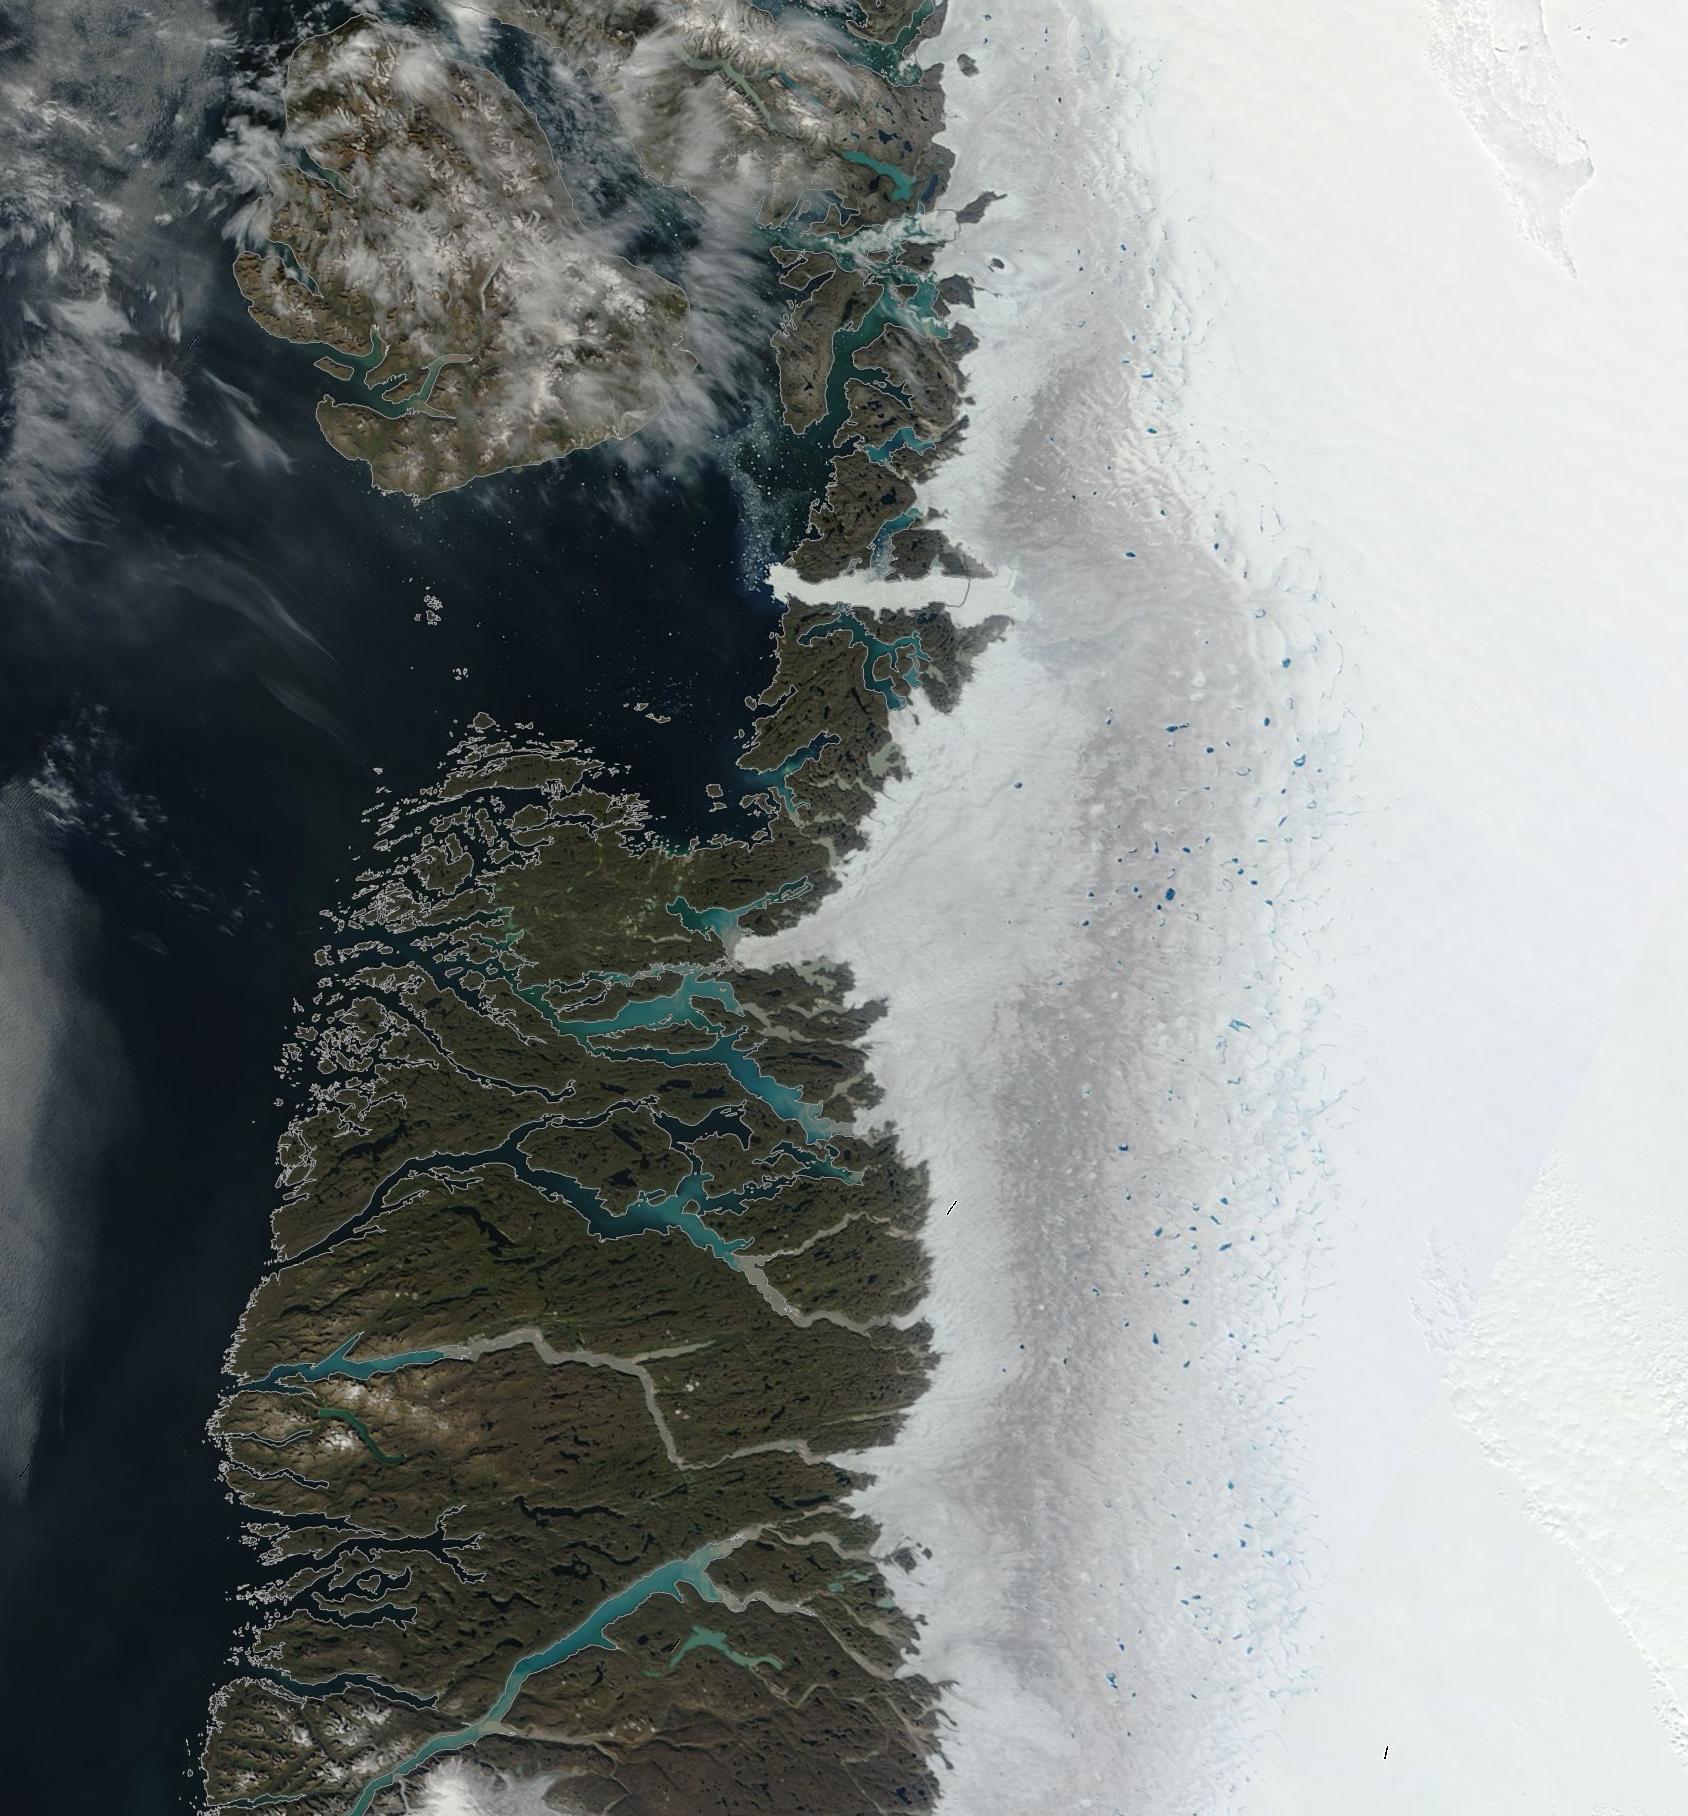
(Extensive surface melt ponding, dark snow near the rapidly melt Jakobshavn Glacier on the West Coast of Greenland in early August of 2014. Image source: LANCE MODIS.)
Ice
Sheet Response Starts Too Soon
By
the late 1990s, various satellites had been lofted to measure the
gravity, mass and volume of structures on the Earth’s surface.
These sensors, when aimed at the great ice sheets, found that
Greenland, during
a period of 1997 to 2003 was losing mass at a rate of about 83 cubic
kilometers each year.
This
rate of ice loss was somewhat small when compared to the vastness of
the ice sheet. But the appearance of loss was early and, therefore,
some cause for concern. More monitoring of the ice sheet took place
as scientists continued their investigation, for it appeared that the
ice sheet was more responsive to human warming than initially
believed.
A
Doubling After Just Six Years
By
2009 another set of measures was in and it found that the six year
period from 2003 to 2009 showed a near doubling of ice mass loss from
the Greenland Ice Sheet. Rates of loss had jumped from 83 cubic
kilometers each year to around 153 cubic kilometers. The doubling
caused consternation and speculation among climate scientists.
Greenhouse gas heat forcing was rapidly on the rise and the world’s
oceans were warming faster than expected as human emissions continued
along a worst case scenario path. It appeared that the ocean was
delivering heat to the ice sheet bases even as atmospheric warming
was melting larger areas upon the ice sheet surface.
These
changes to the massive ice sheets were occurring far more rapidly
than previously considered.
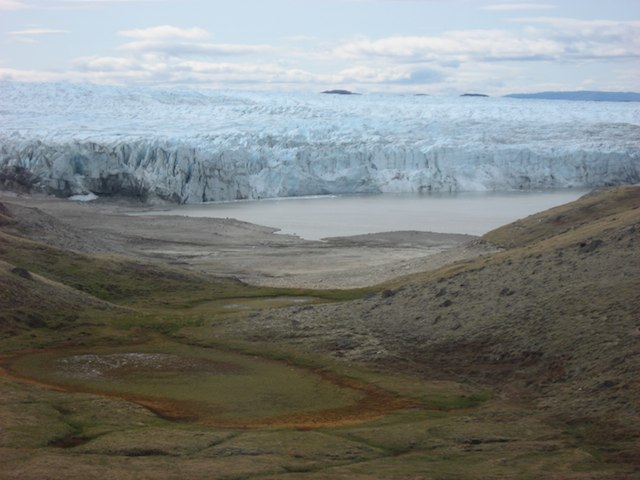
(Hundreds foot high edge of the Greenland Ice Sheet in Kangerlussuaq as seen at the end of a long valley and across a cold estuary. Image source: EISCAT Scientific Association.)
The
potential for a 3, 6, or even 9 foot or more sea level rise by the
end of the 21st Century was raised. Perhaps even more ominous, global
climate models were showing that rapid ice melt in Greenland and West
Antarctica, should it occur, would play havoc with world weather
systems. It was this jump in ice loss, in part, that spurred climate
scientist and then head of NASA GISS, Dr. James Hansen to write his
book The
Storms of My Grandchildren as
a warning that rapid mitigation in human greenhouse gas emissions
along with a stabilization of atmospheric CO2 at 350 ppm would
probably be needed to prevent severe consequences from human-caused
warming.
But
humans kept emitting at a break-neck pace, spending far more money to
build coal, gas and oil based technology, than to reduce energy
consumption through efficiencies or behavioral change or to invest in
alternatives like wind and solar.
Melt
Rates Surge Yet Again
And
so, by January of 2014, heat forcing had continued to accumulate at a
very rapid pace. CO2e heat forcing had spiked to 481 ppm, enough to
melt the entire Greenland Ice Sheet and much of Antarctica as well,
if maintained or increased over a long period.
And
the Greenland Ice sheet was, indeed, melting at an ever faster
clip. For
the most recent assessment found that the loss rate from Greenland
had again more than doubled — hitting a 375 cubic kilometer per
year average during the period of January 2011 through January of
2014.
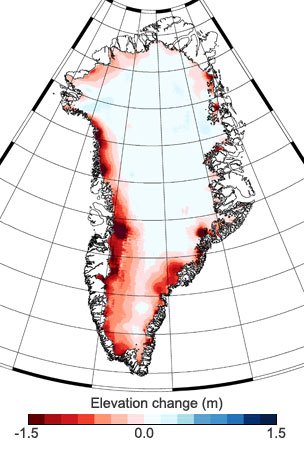
(Greenland Ice Sheet elevation change in meters as found in a recent report by the Alfred Wegner Institute. Note that all Greenland edge zones are now experience elevation losses. Due to higher elevations at the center of the ice sheet, elevation loss at the edge has an effect that speeds ice sheet motion toward the sea. The effect is similar to pushing down the edge of a plastic swimming pool, but on a much larger scale and with somewhat slower moving ice.)
It
was an extraordinary rate of melt now 4.7 times faster than in the
period from 1997 to 2003 and 2.5 times faster than during 2003 to
2009. But, likely, it is but one more milestone on the path to even
faster melt.
The
same study that found the Greenland melt acceleration also
saw a tripling of the melt rate of West Antarctic since 2003 to 2009.
Together, the ice sheets were found to contribute a combined mass
loss of 503 cubic kilometers per year between Greenland and West
Antarctic. This vast, and still apparently rising, loss now meant
that the two great ice sheets were contributing at least one
millimeter per year to sea level rise.
Likely
Grim Future For Sea Level Rise
It
is likely that mass rate losses will continue to increase until some
kind of break or negative feedback comes into play. Similar rates of
melt increase would mean an annual 5-8 millimeter sea level rise by
2035 due to Greenland and Antarctic melt on top of a 2-3 millimeter
sea level rise from thermal expansion of the oceans and from other
melt sources. But even taking into account the cooling effect at the
ocean surface from ice melt and fresh water floods, one could easily
envision the feared 1-3 foot sea level rise by sometime near mid
century and the even more concerning 3-9 foot sea level rise amidst a
very intense battle between hot and cold weather systems through to
century’s end.
As
of 2014, it appears the conditions leading up to the warned of
“Storms of My Grandchildren” are well in play and rapidly
building.
Links:
Hat
Tip to TodaysGuestIs
Greenland’s Late August Rain Over Melt Ponds is a Glacial Outburst Flood Hazard
21
August, 2014
Glacial
melt ponding on steep ice faces. Above freezing temperatures for an
extended period. Storms delivering rainfall to the glacier surface.
These
three events are a bad combination and one that, until recently,
we’ve never seen before for Greenland. It is a set of circumstances
directly arising from a human-driven warming of the great ice sheet.
And it is one that risks a highly violent and energetic event in
which melt ponds over-top and glaciers are flushed and ripped apart
by surges of water rushing for scores of miles over and through the
ice sheet. Major melt pulse events called glacier outburst floods
that can result in catastrophically large volumes of water and broken
ice chunks issuing from the towering, melting glaciers of Greenland
and Antarctica.
It’s
a risk we face now, as the circumstances driving the risk of such an
event are present today.
Rain
over Ice on August 21, 2014
Over
the past four days a high amplitude wave in the Jet Stream and
coordinate domes of high pressure over Greenland have delivered well
above average temperatures for the great Northern Hemisphere ice
sheet. Near and just to the east of the Jakobshavn glacier on the
West Coast of Greenland, temperatures have ranged between 5 and 10
degrees Celsius above average.
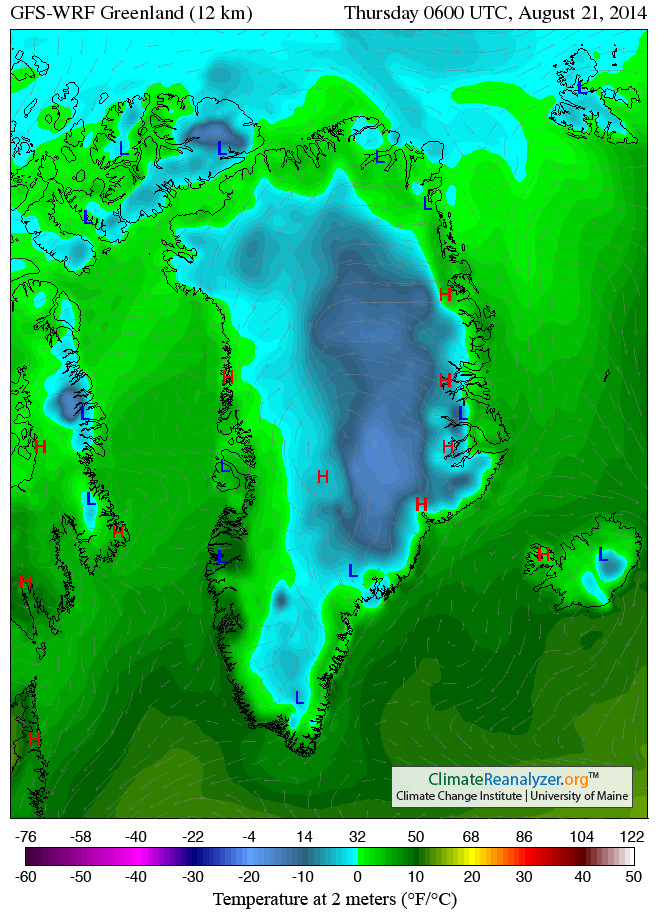
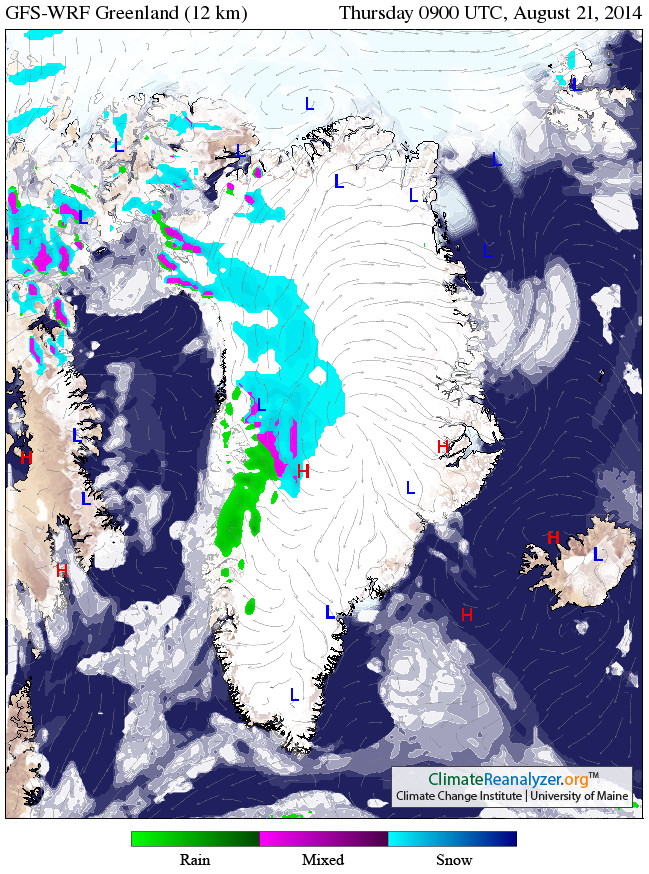
(GFS temperature and rainfall analysis for Greenland on August 21, 2014. Note the above freezing temperatures and rainfall over the region of the Jacobshavn Glacier for today. Image source: University of Maine’s Climate Reanalyzer.)
What
this means is a persistence of average temperatures in the range of
34-40 degrees (F) over large sections of Greenland’s Jakobshavn
glacier. Melt level readings over a region that has now experienced
ongoing surface ponding for more than 60 days.
But
these warm temperatures, providing yet more heat forcing to melt the
ice, aren’t the only extreme weather factor for the Jakobshavn
glacier today. For today has brought with it a warm, wet over-riding
airmass emerging from Baffin Bay and the Atlantic Ocean to the south.
The warm air, coming into contact with the cooler glacier air is
condensing and disgorging a series of rainstorms, dumping
above-freezing water into the Jakobshavn’s already swelling pools.
Some
of these effects are directly visible in the LANCE MODIS satellite
imagery provided by NASA.
Glacial
melt ponds are indicated in the satellite shot below by light-to-dark
blue splotches on the glacier surface. Shallow surface melt ponding
and pooling is indicated by a thin skein of light blue. In the left
frame below, you can see the extensive and large melt ponds in the
region of the Jakobshavn Glacier on August 18, 2014. For reference,
the largest of these ponds are between 2 and 4 kilometers across.
Also note the pale blue color of the ice near the larger ponds,
indicating extensive smaller ponds in the region.
In
the right frame, we have today’s LANCE-MODIS satellite shot. You
will note that the entire frame is covered by cloud but that you can
still see the blue undertone of the melting glacier below the
rain-bearing clouds.
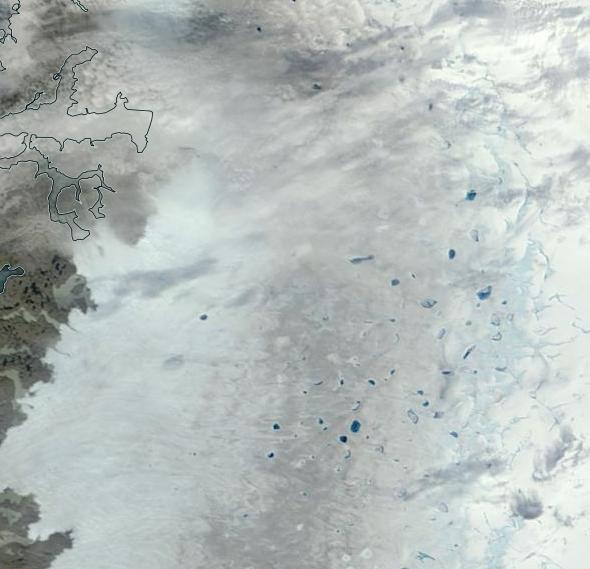
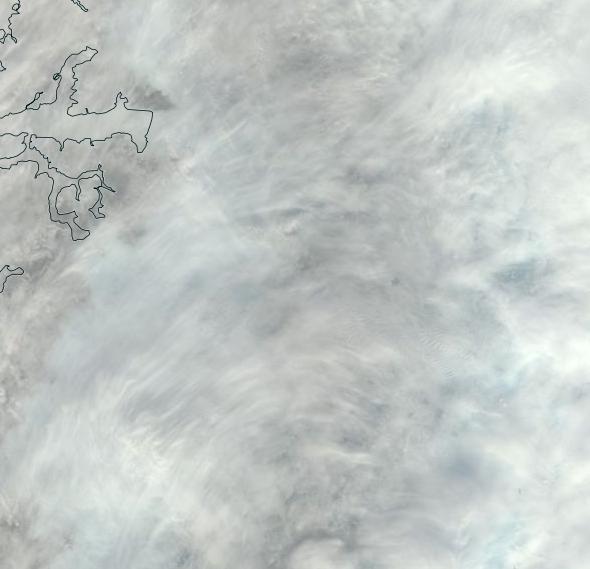
(LANCE MODIS satellite shot of the Jakobshavn Glacier on August 18 [left frame] and August 20 [right frame]. Note the widespread melt ponds and blue ice indicating smaller ponds over the glacier structure. Image source: LANCE MODIS.)
Assessing
Glacial Outburst Flood Risk
Some
day, as Greenland continues to warm under the human heat forcing and
as more hot air invasions ride up over the ice sheet, a period of
warmth followed by rainstorms may well set off a major outburst flood
event. The water content in melt ponds over the glacier may well be
far greater than what we see now and a series of over topping events,
starting higher on the ice sheet and magnifying toward the ice sheet
base, would set of a chain of events leading to such a flood.
Risks
for this kind of event today may well be moderate to low. The
glaciers at this point are craggy and much of the flood waters shunt
through holes in the ice to water pockets or to the glacier base. But
eventually, as the glacier contains more water through subsequent
years of melt, flooding and damming will be more prevalent throughout
the ice sheet. And so risks will likely be on the rise.
Other
than similar events occurring in the Himilayas, we don’t really
have much of a context by which to judge risk for large Greenland
outburst flood events. We do know that melt ponding is now quite
extensive in this region and we do know that the glacier itself is
rather unstable — moving with rapid speed toward the ocean and
containing pockets of melted water from past melt pond formation over
the last two decades.
For
today, I’m pointing out the current rainfall over ice and melt
ponding event as part of a larger and dangerous trend, one that is
likely to play a primary role in the pace and violence of Greenland
melt going forward.
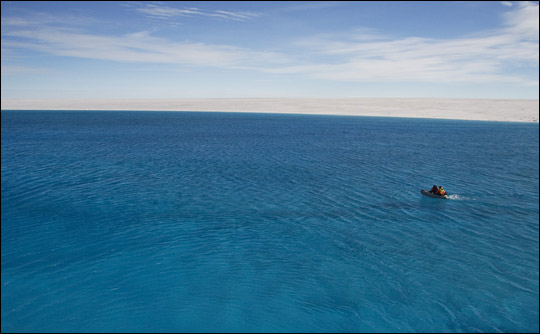
(Photograph of a zodiac on the surface of one of Greenland’s very large melt ponds. Image source: Earth Observatory.)
Links:
No comments:
Post a Comment
Note: only a member of this blog may post a comment.